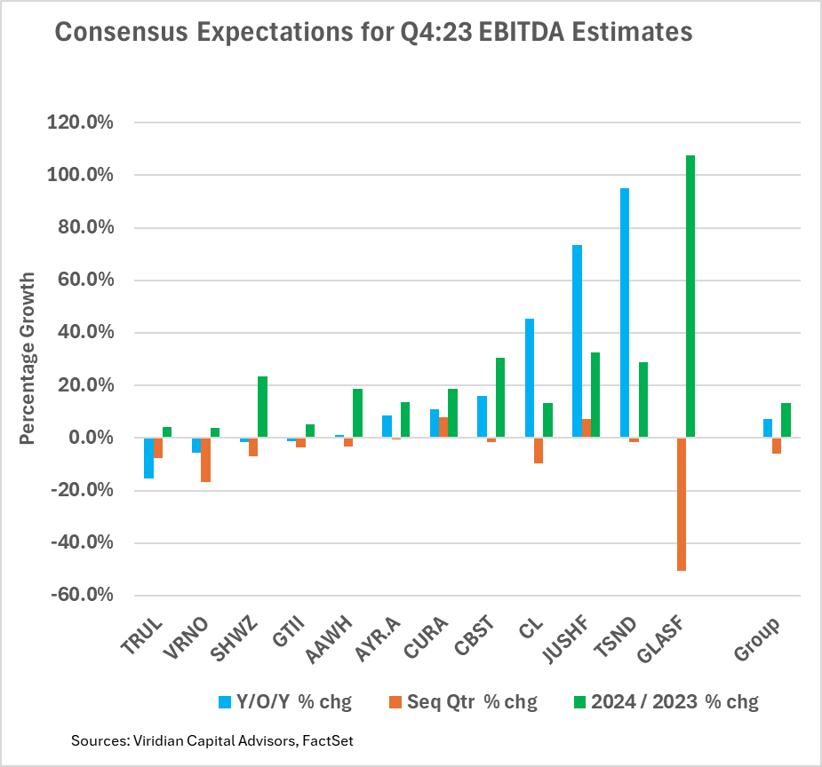
4th Quarter cannabis earnings releases commence this week, and the graph depicts the consensus expectations for twelve of the largest MSOs.

-
The blue bar shows the expected percent increase in EBITDA from Q4:22 to Q4:23. The orange bar measures the expected sequential quarter percentage growth in EBITDA from Q3:23 to Q4:23, and the green bar shows the expected percent increase in EBITDA from 2023 to 2024.
-
Companies with the lowest Y/O/Y growth are on the left.
-
Several trends in the data were somewhat surprising:
-
Sequential quarter growth was negative for ten of the twelve companies shown. We might expect a greenhouse grower like Glass House (OTC:GLASF) to have a lower Q4 since the sunlight is less intense in the winter months, but we saw strong dispensary results in December that we thought might transfer to higher Q4 revenues. EBITDA for the group is projected to be down 5.9% from the third quarter.
-
We also find it curious that year-over-year growth is weighted strongly to the smaller companies in the group. Seven companies had significantly higher growth than the aggregate of 7.2% for the group. Still, their relatively small size muted the impact of large growth rates for companies like Jushi (OTC:JUSHF) and Terrascend. The likely explanation for some of the anemic large-cap growth is the abandonment of several markets, including Trulieve (OTC:TCNNF) departing Massachusetts, Curaleaf (OTC:CURLF) leaving California, Colorado, and Washington, and AYR (OTC:AYRWF) saying goodbye to Arizona.
-
-
Concentrating on more profitable markets is an important driver for what we think may be a better-than-expected 2024. Additionally, the companies on the chart have shed opex, tightened working capital controls, and avoided non-critical Capex. In short, they are lean and poised to surprise on the upside.
-
We pay more attention to earnings estimate revisions than the estimates themselves. The 13.4% expected growth in 2024 EBITDA is driven by a modest 5.8% growth in revenues with a 7.2% increase in EBITDA margins. We will monitor and report on revisions after the releases.
-
We think there is a decent chance that the analysts, chastened by having to revise 2023 projections downward continually throughout 2023, may be undershooting the target for 2024.
The Viridian Capital Chart of the Week highlights key investment, valuation and M&A trends taken from the Viridian Cannabis Deal Tracker.
The Viridian Cannabis Deal Tracker provides the market intelligence that cannabis companies, investors, and acquirers utilize to make informed decisions regarding capital allocation and M&A strategy. The Deal Tracker is a proprietary information service that monitors capital raise and M&A activity in the legal cannabis, CBD, and psychedelics industries. Each week the Tracker aggregates and analyzes all closed deals and segments each according to key metrics:
-
Deals by Industry Sector (To track the flow of capital and M&A Deals by one of 12 Sectors – from Cultivation to Brands to Software)
-
Deal Structure (Equity/Debt for Capital Raises, Cash/Stock/Earnout for M&A) Status of the company announcing the transaction (Public vs. Private)
-
Principals to the Transaction (Issuer/Investor/Lender/Acquirer) Key deal terms (Pricing and Valuation)
-
Key Deal Terms (Deal Size, Valuation, Pricing, Warrants, Cost of Capital)
-
Deals by Location of Issuer/Buyer/Seller (To Track the Flow of Capital and M&A Deals by State and Country)
-
Credit Ratings (Leverage and Liquidity Ratios)
Since its inception in 2015, the Viridian Cannabis Deal Tracker has tracked and analyzed more than 2,500 capital raises and 1,000 M&A transactions totaling over $50 billion in aggregate value.
The preceding article is from one of our external contributors. It does not represent the opinion of Benzinga and has not been edited.


Be the first to comment